Lesson Outline
SERIES: Making sense of the campaign / Lessons in News Literacy. Drawing upon the 2016 presidential campaign for examples, this series of teacher's guides provides everything instructors will need to tailor foundational News Literacy lessons to their students and classroom. You'll find a detailed briefing identifying and applying specific News Literacy concepts, clear objectives and takeaways, multimedia, discussion questions and assignments that can be used in the classroom or as homework. We're also providing a PowerPoint presentation for classroom use that you can use or modify. As the campaign unfolds, we will supplement this guide with timely examples.
TOPIC: Journalistic truth and what it tells us about political polling.
CONCEPTS: The News Literacy concepts of context, transparency and provisional truth are key tools in the critical thinking news consumers must do to assess the reliability and importance of campaign polling data.
OBJECTIVE: Students should learn how to apply these concepts to determine if a political poll presents reliable or suspect information and why. They should take away from this lesson a solid understanding of provisional truth, the role of context and transparency in the journey from fact to truth and the key questions news consumers should ask themselves every time they read or watch news reports based on polling data
 Download this lesson as a PowerPoint presentation to use in your classroom.
The truth about polling
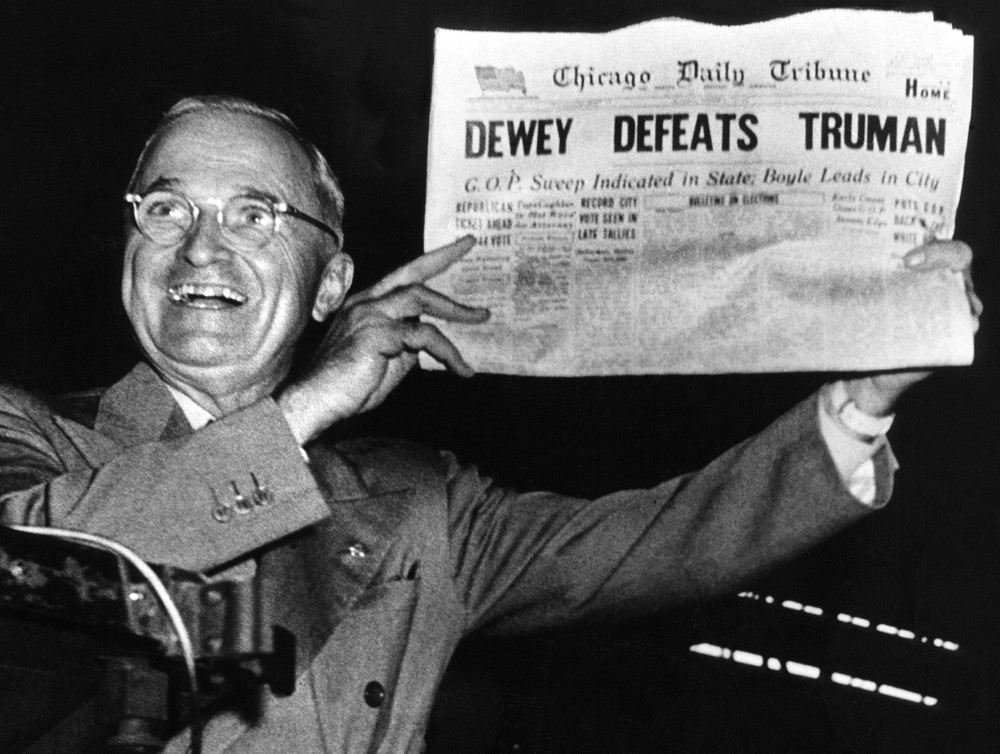
The picture of a triumphant President Harry Truman posing with a newspaper proclaiming the victory of his 1948 election opponent remains one of the most famous news photos in history for good reason. The huge banner headline was wrong.
Truman’s win had surprised the Chicago Tribune and today, more than a half-century later, stands as a cautionary tale about the nature and limitations of political polling.
Truman had gone to sleep that evening believing he had lost the election to New York Gov. Thomas E. Dewey. The Chicago Tribune’s decision to go ahead with the headline was based on polls, including the well-respected Gallup Poll, which had showed Dewey well out in front of Truman (who had only become president in 1945 upon the death of Franklin Delano Roosevelt). In one of the greatest upsets in American political history, Truman won the electoral vote (the only vote that counts) by the substantial margin of 303-189. He won the popular vote by only 3 million votes.
Does that mean the Gallup Poll was as wrong as the newspaper headline? No, and the reason why involves a key News Literacy concept called "Provisional Truth."
PROVISIONAL TRUTH
News Literacy teaches us that journalistic truth is provisional — the truth, or at least, our understanding of it, at a specific moment in time. It can change as more information surfaces or circumstances change. A political poll, under the best circumstances, is just that — a snapshot in time, subject to change. The Gallup organization would later say it had made a mistake in 1948 by stopping its polling the week before Election Day, before a late move to Truman by undecided voters. It was a reminder that political polls can only tell us something about a moment in the past, not the future.
Fast forward to March 8, 2016, and as voters go to the polls in the Michigan Democratic Party primary, all the polls say it will be an easy win for Hillary Clinton. A win by Bernie Sanders would be “among the greatest polling errors in primary history,” said Nate Silver, editor and founder of FiveThirtyEight.com, the widely respected news data site that took its name from the 538 votes in the Electoral College. And that's just what happened. Sanders upset Clinton with a narrow victory no one saw coming.
How? There were a number of factor, including poling models that underestimated the turnout of young Sanders supporters and independents. But one factor cited by polling analysts hearkened back to Harry Truman's upset win more than a half-century earlier. "Pollsters missed a late break to Sanders by not polling after Sunday," reported Five ThirtyEight. "Clinton and Sanders debated in Flint on Sunday and met in a town hall in Detroit on Monday. No public pollsters contacted voters after either event."
Political polling has grown far more sophisticated in the digital age, but the concept of provisional truth is no less applicable. The introduction of a 24-hour news cycle, social media and a proliferation of pollsters have only increased the volatility of the electorate and the need to view poll results critically.
“Even within a week of a primary election, the polls are often inaccurate,” Harry Enten says in “Harry’s Guide to 2016 Election Polls.” Enten is senior political writer and analyst for FiveThirtyEight.
The lesson? The farther away you are from voters casting ballots, the less reliable the poll.
A week before the Michigan primary, CNN’s website reported “National poll: Clinton, Sanders both top Trump.” The story highlights box said, “Clinton tops Trump 52% to 44% among registered voters.” The CNN/ORC poll, typical of the “horse race polls” we have seen throughout the campaign season, raises a number of important questions for news consumers. If polls got the Truman race wrong by stopping its polling a week before Election Day, how much meaning should we ascribe to the results of a CNN poll taken eight months before votes are cast?
Enten also cautions against putting too much stock in polls asking “if the election were held today” hypothetical questions, which he says are designed to force undecided voters to select a candidate they may not wind up supporting.
Detailed studies of how people make up their minds show that there is a significant percentage of respondents who tell pollsters they are undecided when they are not. Others may express a preference one day and switch candidates the next after a poor debate performance or an unfavorable revelation.
What you can count on is that the farther you are from the day ballots are cast, the more voter volatility comes into play. The most valuable polling information, not surprisingly, often comes from exit polls taken on Election Day.
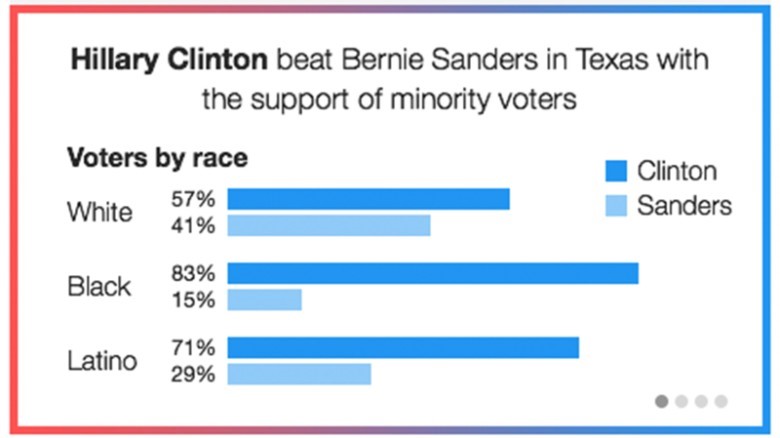
Super Tuesday exit polls not only told us who was winning before all the votes were in, they offered insight into why they were winning. It wasn’t surprising that Hillary Clinton did better than Bernie Sanders among nonwhite voters, but only exit polls could tell us how much better she did. Here's how CNN reported this exit poll finding:
So with the release of every new horse race poll, remember the concept of provisional truth and the best advice for news consumers encountering it — follow the story over time. Watching polls over time can tell you which candidates are growing in strength and which ones may be fading. Remember, too, that no truth may be more provisional than efforts to measure public opinion.
WHAT IS A POLL?
The concept of provisional truth, of course, only enters into the equation if what you are evaluating is actually a poll. The terms “poll” and “survey” are often used interchangeably, but the distinction is important. A poll employs a statistical methodology. A simple survey does not. There is no such thing as an “unscientific” or “informal” poll.
To be precise, an unbiased, scientific opinion poll uses trained interviewers to ask carefully worded questions of a particular random but representative sample that can reveal the preferences or beliefs of a given population. If a TV reporter interviews 10 randomly selected pedestrians to see which candidate each supports, the sample is far too small to be considered statistically representative. If a news website asks readers to vote in an Internet poll, the sampling can’t be considered random because the respondents selected themselves.
Once news consumers have established that the “poll” is actually a poll, there are two other News Literacy concepts that come into play — context and transparency.
CONTEXT
Although they often are, raw poll results cannot be taken out of context. To put the numbers in perspective, news consumers should not only ask when the poll was taken, but also who answered and asked the questions and what the other polls are saying.
1) Who was polled?
News Literacy teaches one of the most important questions a news consumer can ask when evaluating a report is: “Says who?” The more authoritative and trustworthy the source, the more credible the report. When it comes to political polling, that means first determining who the pollsters surveyed.
The CNN/ORC poll that concluded both Clinton and Sanders would beat Trump if the election were held today was based on nationwide interviews of 920 registered voters (actually, 910 — the other 10 said they planned to register).
What’s the problem? There are two, actually.
First, the poll surveyed a national audience. The primaries are state-by-state contests. There is no national vote for the Republican Party nomination or, for that matter, the presidency, where Americans cast ballots to determine each state's Electoral College votes. National poll results can be interesting, but that’s about it.
Second, the best polls survey likely voters, not just registered voters, FiveThirtyEight.com’s Enten says — especially during the primary season. “Primaries tend to attract lower participation rates than presidential general elections,” Enten told “On the Media,” on National Public Radio. “So we don’t want to just take a poll of all the possible voters, we want to take a poll of likely voters, the people who are actually going to show up and vote in that primary.”
2) Who conducted the poll?
Who is asking the questions can be as important as who is answering them. Independent polling organizations with a strong track record are the most reliable. “Polls sponsored by major news organizations (ABC News, NBC News, The New York Times, etc.) are often the most accurate because more money is spent on them,” Enten says. “If you haven’t heard of a pollster before, there’s probably a good reason for it. If you’re in doubt, check the FiveThirtyEight Pollster Ratings.” CNN/Opinion Research Corp., for example, got a respectable A-minus from Five ThirtyEight.com.
3) What are the other polls saying?
Perhaps the most important way to put results of an individual poll into perspective is to view it in the context of what other polls are saying. Like witnesses in a trial, when multiple polls are telling the same story, it gains credibility. When different organizations are getting wildly different results, caution is in order. And when one poll makes headlines because it is showing something none of the others do, it’s an “outlier” in Enten’s book — something news consumers should look at skeptically.
“Outliers tend to get outsized media attention and most times,” Enten says, “outliers are outliers for a reason, and that is that they are incorrect.”
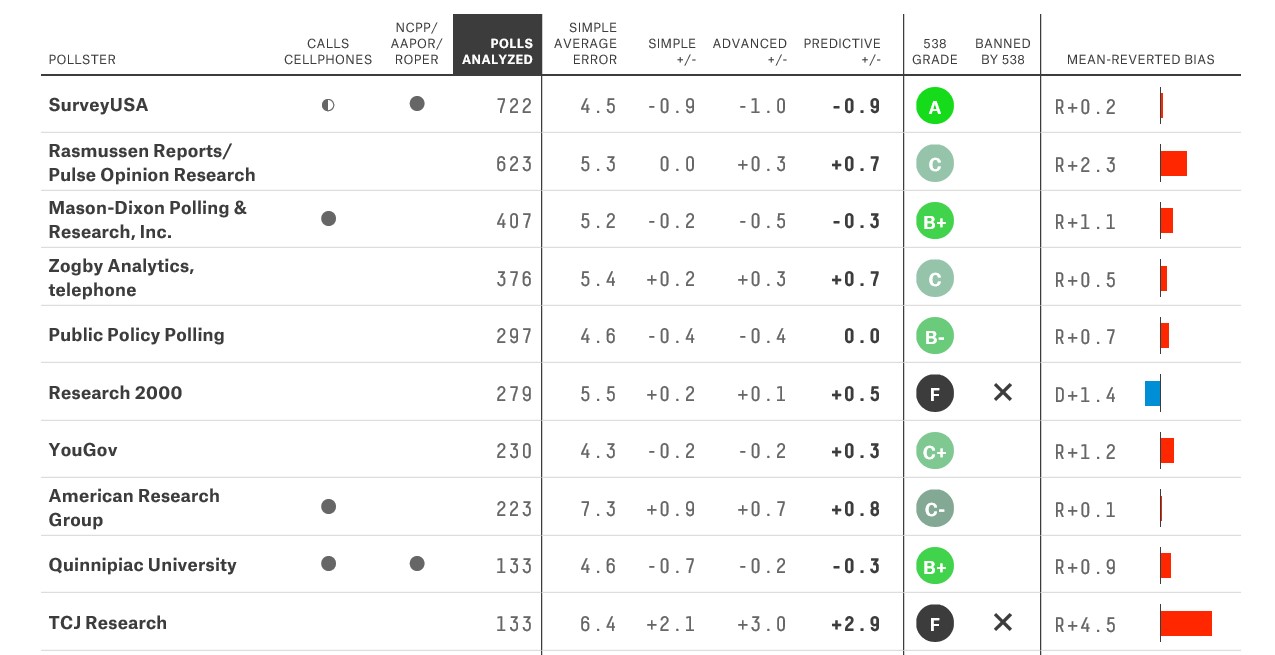
Led by FiveThirtyEight.com’s Nate Silver, analysts are comparing, contrasting and aggregating all the different polls. Using this approach, Silver in particular has been uncannily accurate in interpreting the polls. Here's an example from FiveThirtyEight.com that averages national polling numbers, taking into account how recent the numbers are, the size of the sample and the quality of the pollster. Because they are national numbers, they don't predict how any of these GOP candidates will do in state primaries, but it does show how they've been viewed by the general electorate over time.
![]()
TRANSPARENCY
Transparency — when journalists are honest about what they know, how they know it and what they don’t know — is best served when a report tells news consumers how the poll was conducted and unfailingly reports whether the results fell within the margin of error.
The margin of error is a calculation based on the sample size in relation to the overall population. Here’s how the Gallup organization explains it: “If the results of a scientific poll claiming a 3-point margin of error say that 30% of Americans like ice cream, this means that if we asked all Americans this question, we would expect between 27% and 33% to say they like ice cream.”
Donald Trump and Ted Cruz were separated by two percentage points in the NBC/Wall Street Journal poll released Feb. 18, which had a margin of error of 4.9 percentage points. So, statistically, it was too close to call.
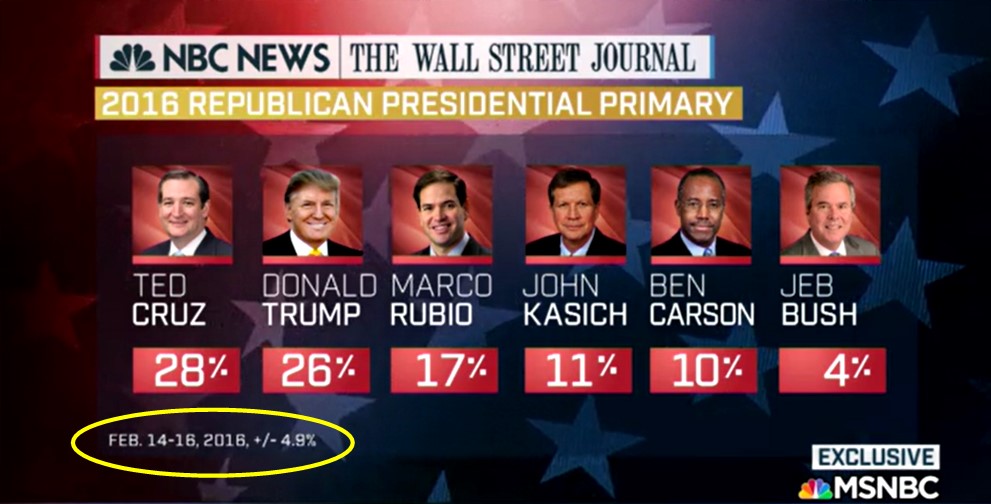
The most honest way of reporting this poll’s results would have been to say there was no clear winner. Instead, the news release announcing the new poll results was headlined: “Donald Trump Falls Behind Ted Cruz in National NBC/WSJ Poll.”
Reports of political polling results gain credibility when they are transparent about how information was collected, which has become increasingly important. The most reliable method of polling employs telephone interviews, but that has gotten much harder in recent years. The digital age shifts from landlines to mobile phones has reduced the pool of prospective respondents, as has the public’s attitude toward talking with pollsters. Fifty years ago, pollsters found the 90 percent of people they reached by phone would agree to partake in the poll. Now it is below 10 percent, and pollsters find themselves having to adjust for the reality that these respondents are disproportionately older and more conservative.
As a result, political polling has evolved to a point where it as much an art as it is a science. That’s particularly true when comes to predicting which groups will vote in what numbers. This determination can significantly affect the poll’s accuracy. A recent case in point: The Iowa Caucuses, where most of the pollsters predicted that Donald Trump would win and, instead, Ted Cruz came out on top. The pollsters attributed the problem to underestimating the evangelical vote. They guesstimated a 60 percent evangelical turnout when it turned out to be 64 percent. The polls were even farther off in Michigan, where pollsters underestimated the turnout of young voters for Sanders.
While news consumers weren’t likely to have seen that coming, no matter how transparent the pollsters might have been about their statistical assumptions, the Iowa and Michigan primaries stand as a reminder of the limitations of political polling. Viewed knowledgeably, polling information can reveal trends, tell you why people voted the way they did and offer insights into how voters view candidates and issues. What they can't do, as Harry Truman's 1948 election proved, is predict the future.
THE TAKEAWAY
1. Truth is provisional. At best, a poll is a snap shot in time, not an accurate predictor of the outcome. Perhaps nothing is more provisional than public opinion.
2. “Facts,” in this case the numbers from a political poll, don’t necessarily equate with truth. To determine the value of a poll, consumers need to search for context and ask critical questions. It is easy to be misled.
3. Remember the importance of context — the information needed to put facts into perspective. When was the poll taken, who were the respondents and how were they chosen. Are other polls coming up with similar findings?
4. Be aware of how transparent the poll is in reporting the “margin of error” and the methodology used to get the results.
DISCUSSION QUESTIONS
1. Watch this video excerpt from one of the Republican debates. Do you think poll results have taken on too large a role in the 2016 presidential campaign?
2. Does the news media focus too much attention on political polling results?
3. Your phone rings. Caller ID says it’s the Gallup organization. Would you take the call and answer its polling questions? Would the answer be any different if the pollster said he was working for a specific campaign?
ASSIGNMENTS
ASSIGNMENT A
Watch this news report and answer these two questions:
1. What can you conclude about who was polled?
2. How does the concept of provisional truth apply to these poll results?
3. If you were the editor in charge, how would you have reported the results of this poll?
Answer key:
1. Whether you looked at the race for the Republican nomination or the hypothetical general election matchups, the results of a national poll have little meaning in state-by-state contests. Students may also note that the respondents were registered voters, not likely voters.
2. At best, these findings so far from Election Day can give you a sense of how these candidates are viewed nationally at this particular moment. While it may be interesting to compare them with past polls, they tell you virtually nothing about how the November election will turn out.
3. Look to see how well students apply these lessons.
ASSIGNMENT B
Watch the following video and read the accompanying news story.
Ask the students these questions:
1. What can you conclude about the poll and its coverage when you answer these three context questions?
a) Who was polled?
b) When they were polled?
c) Who did the polling?
2. Were these reports transparent about the margin of error and its role in evaluating the results?
3. Do each of these news reports on the same poll offer you enough context and transparency to evaluate its reliability and relevance?
Answer key:
1. The context questions:
a. The pollsters talked with Long Islanders, the primary audience for both Newsday and News 12. Neither report pointed out that there is no Long Island primary. Long Islanders represented less than 2 million of the 11.7 million New York state voters registered in November 2015. Like the national polling results, these were more interesting than important. Sharp students also may note that poll was of 984 “registered” voters — not necessarily “likely” voters.
b. The poll was conducted Feb. 14-18 and 21-22, a fact contained in the news article but not the video news report. The significance is that the New York primary was two months away (April 19) and the general election was nearly nine months away, so the results would have to be considered “provisional truth,” a snapshot in time far too distant from either event to carry much statistical validity.
c. The polling was done by two news organizations in conjunction with Sienna College, so it was certainly independent.
2. The margin of error was particularly important in the hypothetical Trump vs. Clinton matchup. In the Newsday story, the first report of those results did not point it out. Two paragraphs later, the story said: “If the general election were to pit Trump against Clinton, Long Islanders favor Trump 41-38 percent — which is within the poll’s margin of error of plus or minus 3.1 percentage points.” The TV report never mentioned the margin of error at all.
3. The TV report provided very little information about the poll, beyond the major results. While there was much more detail in the news article, neither put the results in a statewide perspective. Nor did either caution news consumers about the distance from actual voting.
RESOURCES
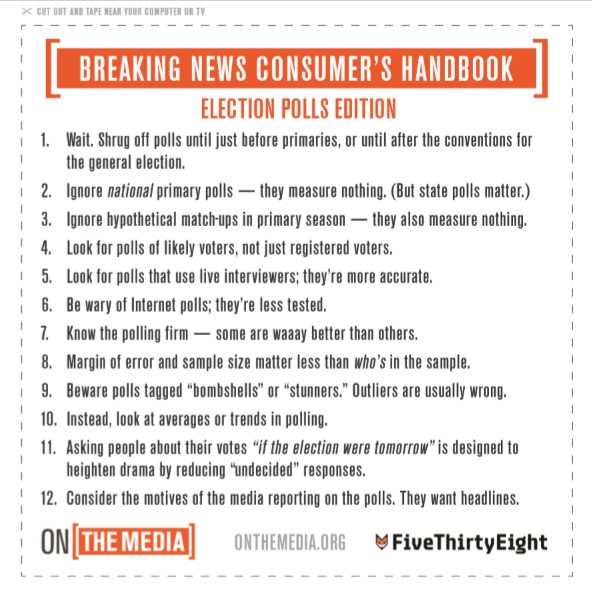
http://www.onthemedia.org/story/breaking-news-consumers-handbook-election-polls-edition/
http://fivethirtyeight.com/features/harrys-guide-to-2016-election-polls/
http://www.newyorker.com/magazine/2015/11/16/politics-and-the-new-machine
http://fivethirtyeight.com/features/iowa-teaches-pollsters-to-poll-until-the-end/
http://fivethirtyeight.com/interactives/pollster-ratings/
http://fivethirtyeight.com/features/why-the-polls-missed-bernie-sanders-...
http://media.gallup.com/muslimwestfacts/PDF/PollingAndHowToUseItR1drevEN...
HISTORICAL FOOTNOTE
"DEWEY DEFEATS TRUMAN" The famous photograph was actually taken by W. Eugene Smith two days after the election as President Harry Truman was taking a train back from his home in Independence, Missouri and they had stopped in St. Louis where an aide gave the president the paper with the incorrect headline.
Looking for a previous lesson? Check out our ARCHIVE of News Lessons
-
Key Concepts
-
Course Sections
-
Grade Level
-
0 comments
-
0 saves
-
Share